

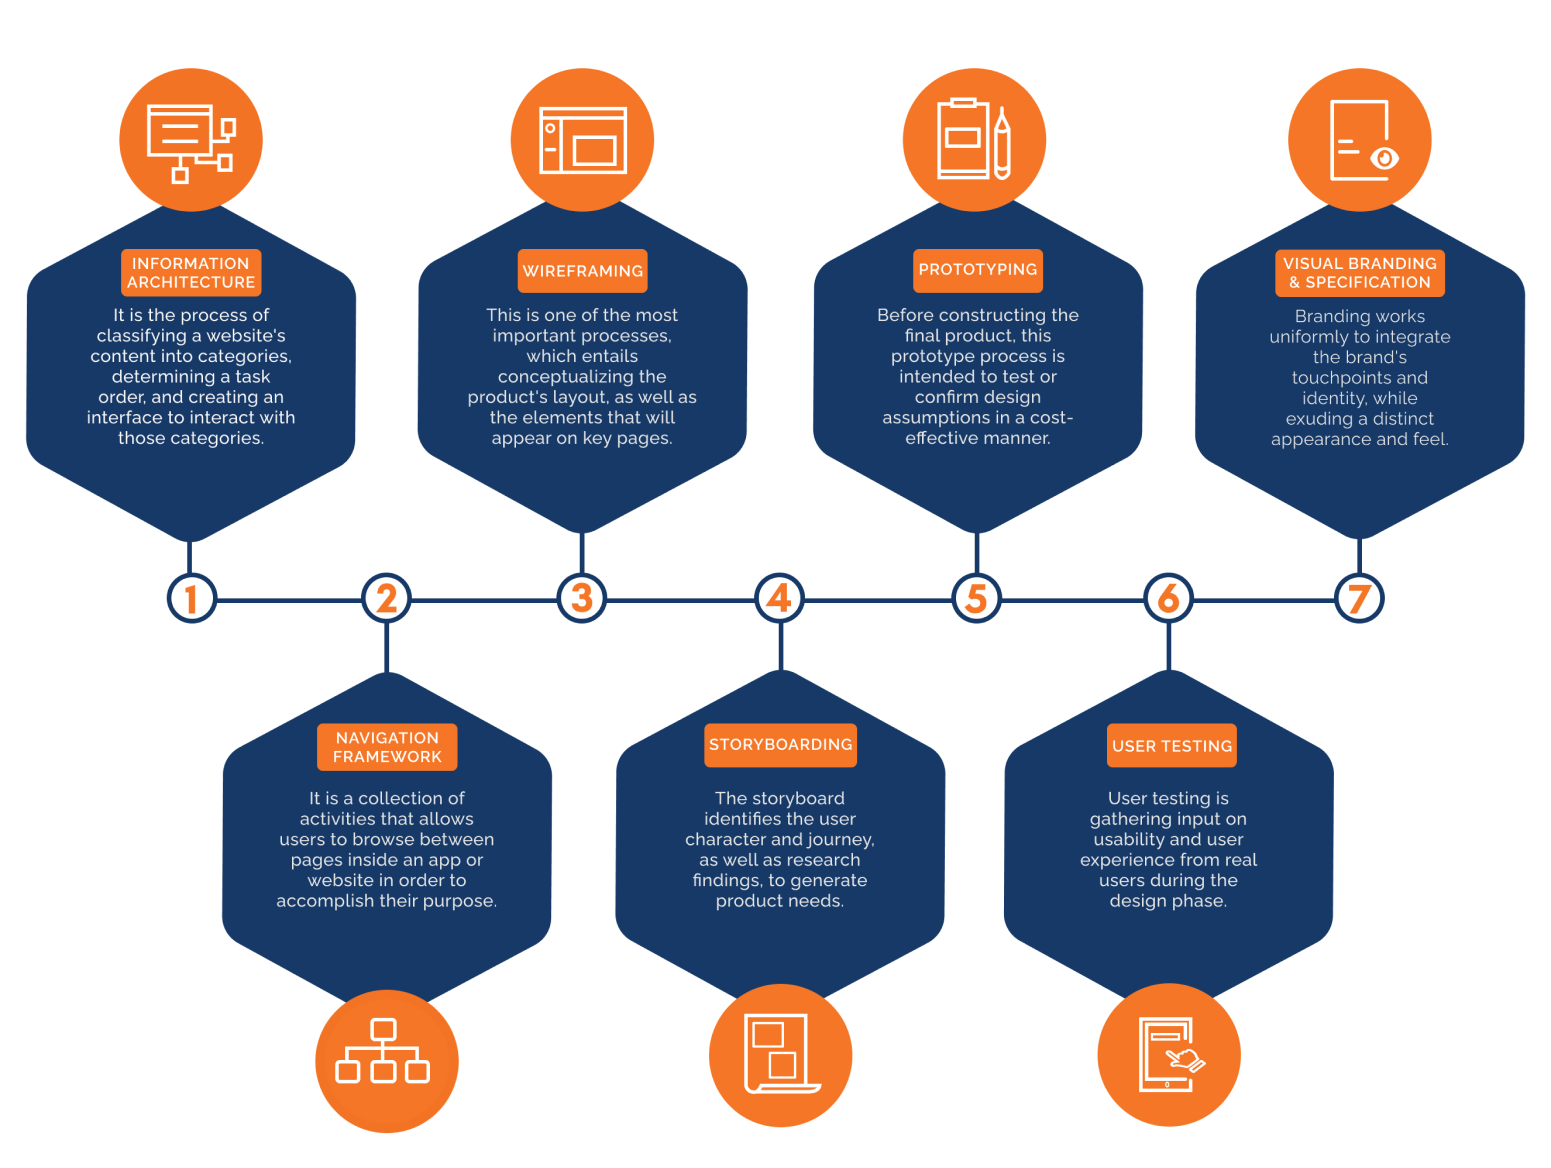
User experiences aross platforms and digital interfaces
In a digital landscape, every business needs the experience of their users to be relevant, delightful and impactful. As customers and users both become digitally mature, UI UX also stands at a critical juncture to come to an age, propelling user journeys and interactions to the next level of a smarter, future-oriented reality.
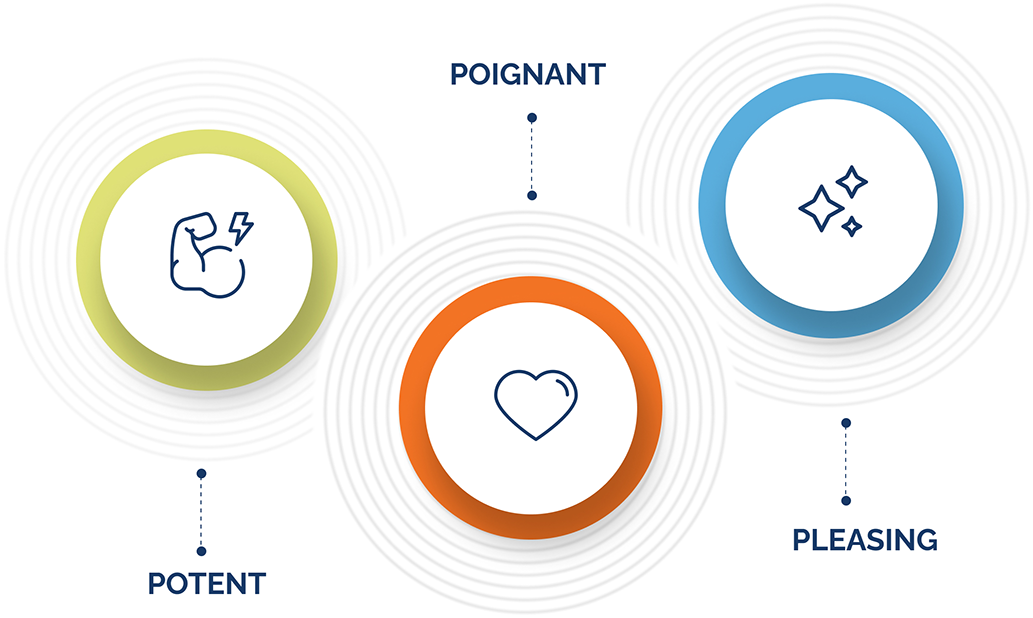
As we all advance into engaging with design that makes us react, is integral that we ensure compelling user experience journeys with a sturdy process is key, to have a foreseeable future ingrained with reality.

It is easier to build trust with people through aesthetically intuitive solutions, and therefore, you are more likely to attract users, convert them into customers.

By optimizing how intuitive the experience is, better planning interactions, and improving calls to action that lead to revenue growth, you can ensure you always outperform your best results.

Design may be more agile and scalable if UI/UX designers anticipate users’ needs before going to production.

Engagement metrics are very valuable, as they indicate what your customers find valuable and what drives them to take action.

As a prototype is a UX-stage deliverable that mimics the final product and appearance,
allowing for correction before the final product. Thus reducing the budget spent on the correcting easily avoidable mistakes.
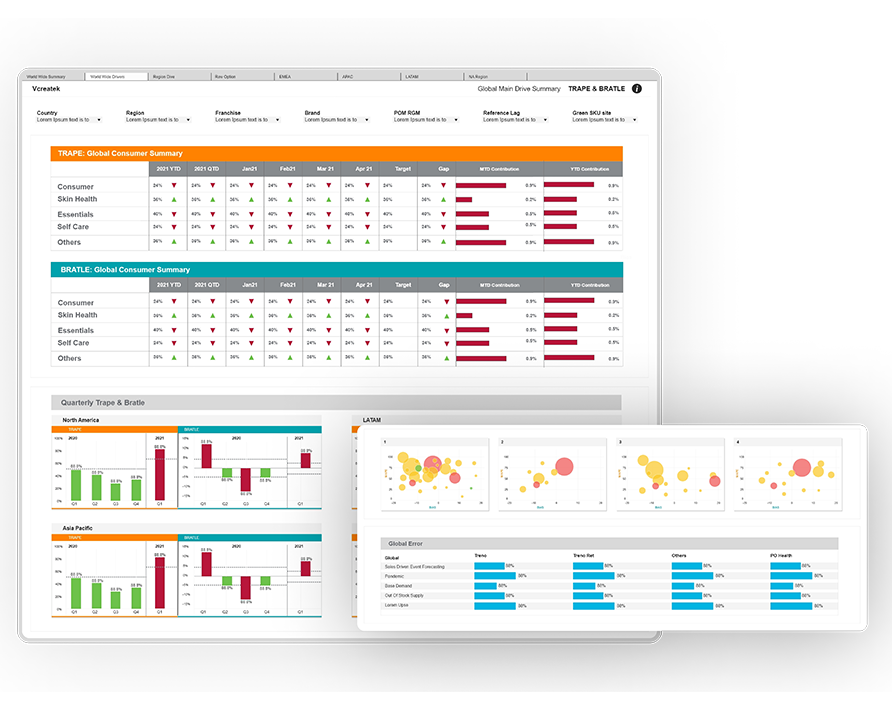
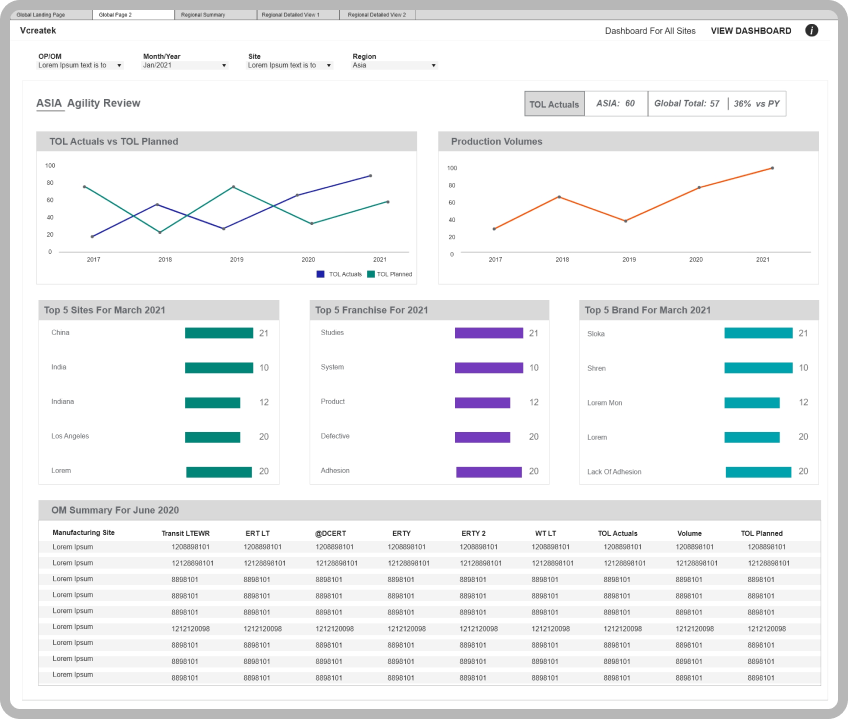
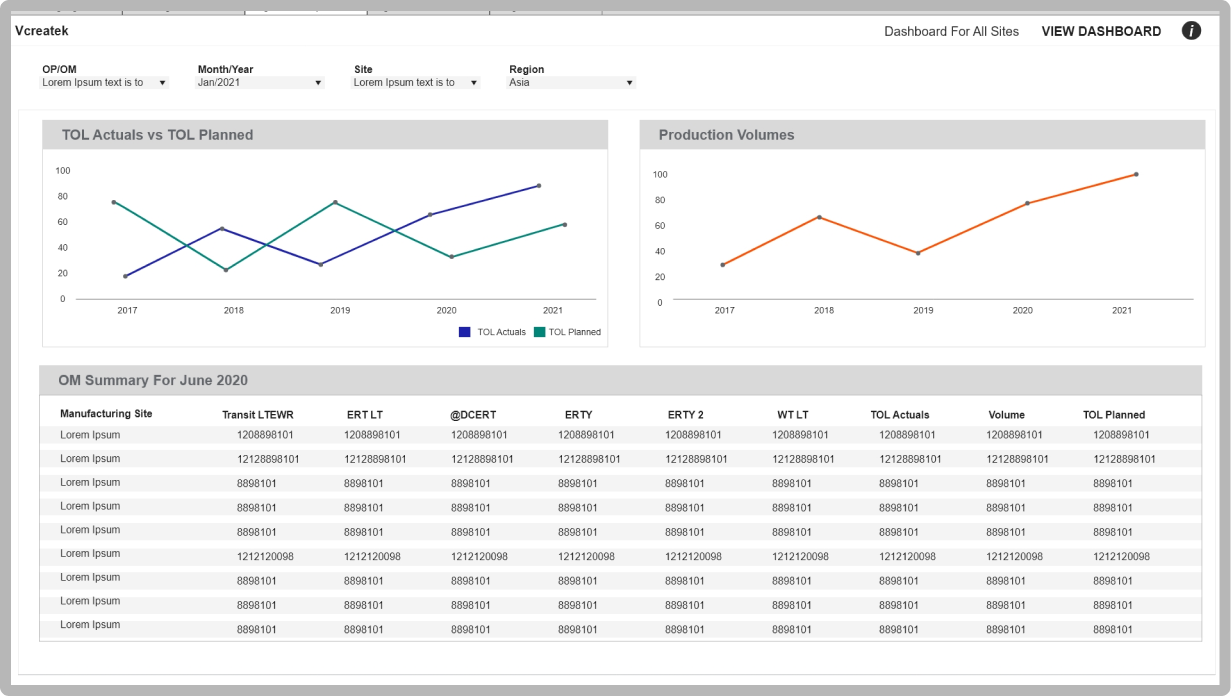
This report would enable all local/regional/global teams to deep dive into the NAPE & LIAS reporting with a new lens without leaving behind the regional capabilities which are currently embedded as part of regional reporting.

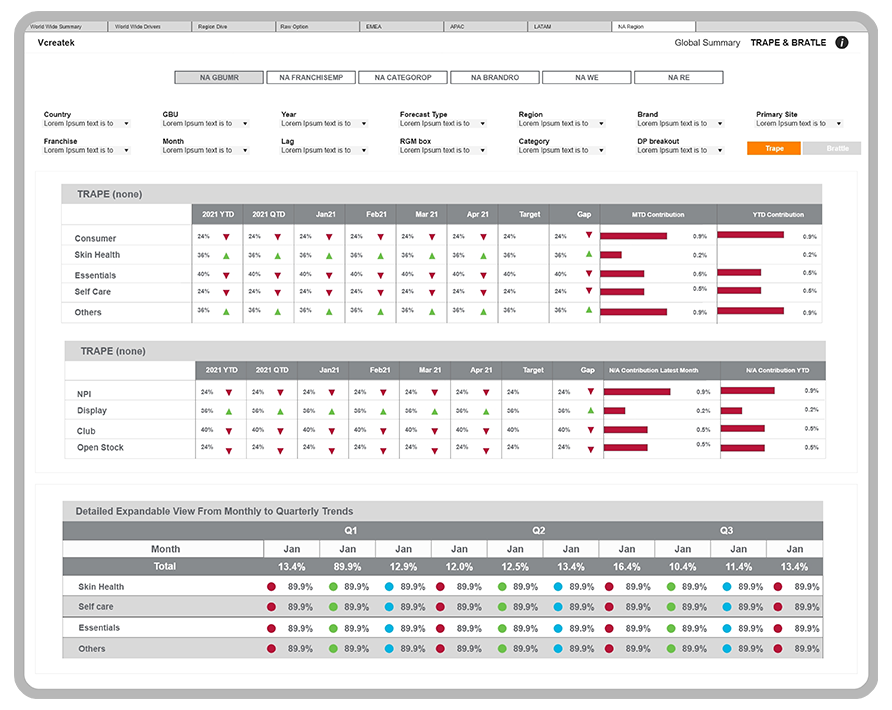
This dashboard allows the measure of two metrics IM and PSA with great detail. Mesauring their performance across, region and comparing them with different
scenarios.
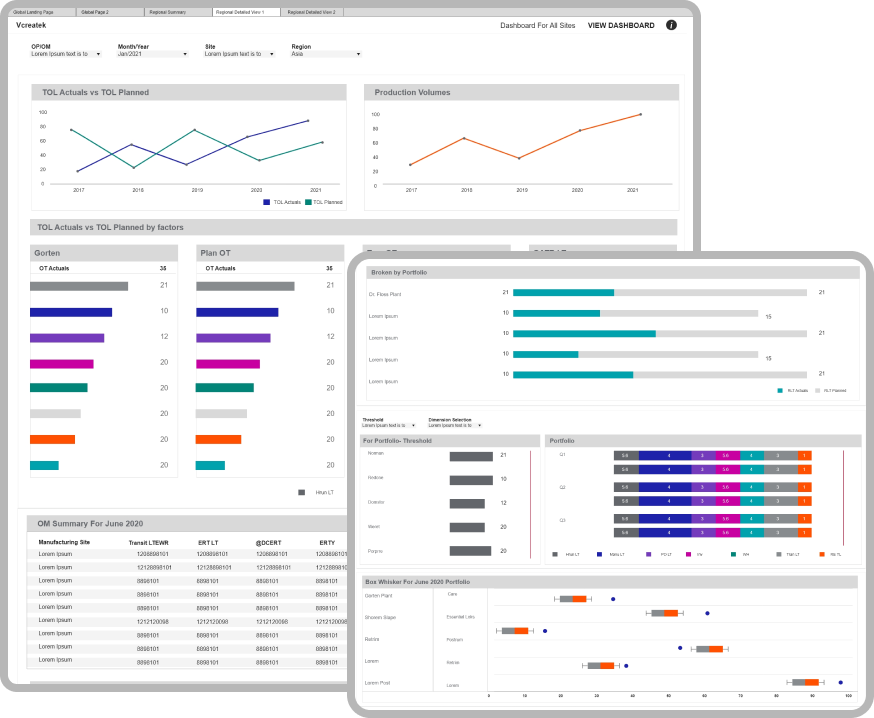
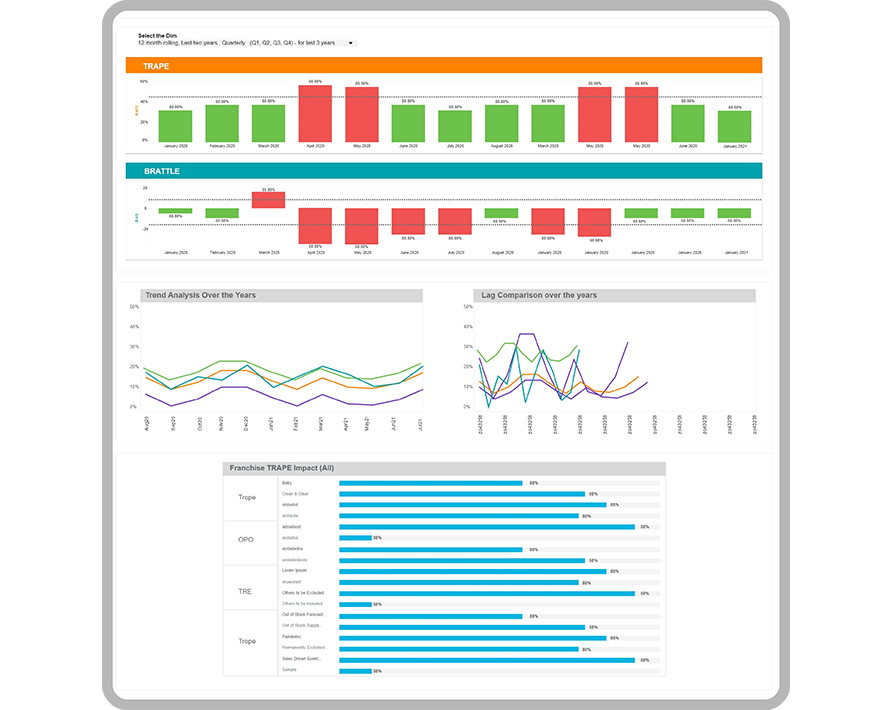
TLR- time for Lead Replenishment. It aims to comprehend, analyze and portray the progress and time required for lead replenishment in different areas.
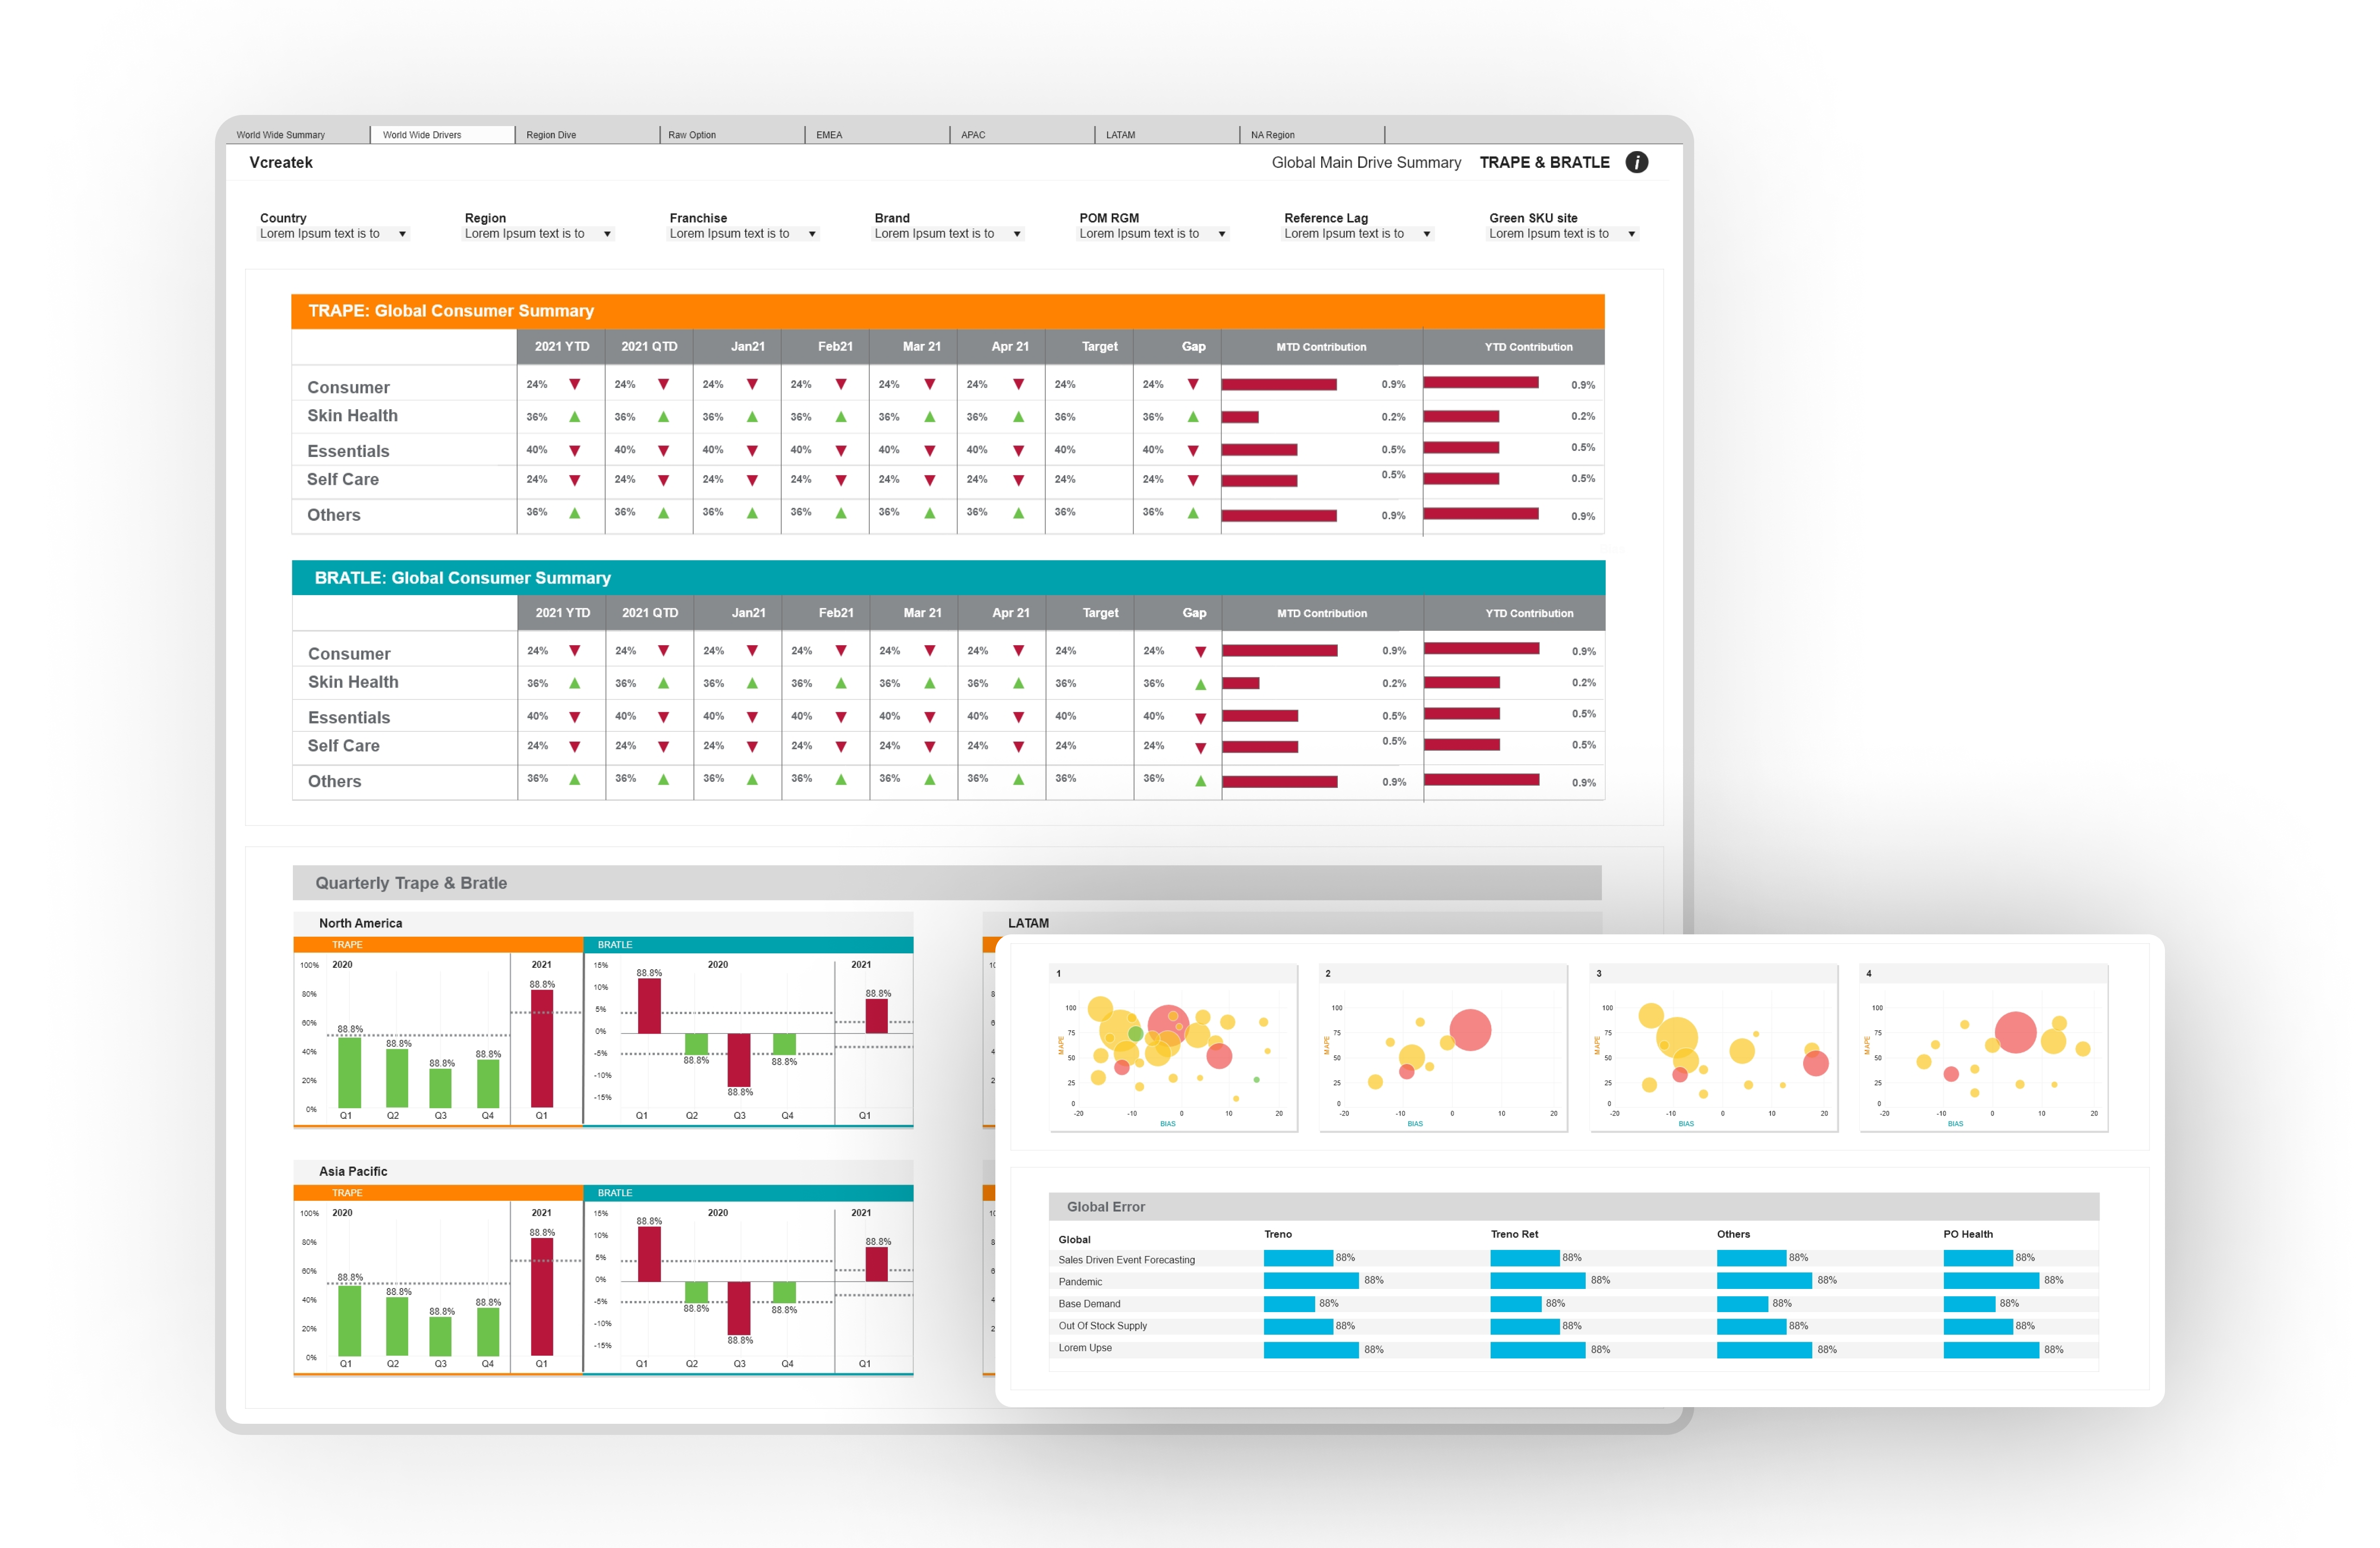
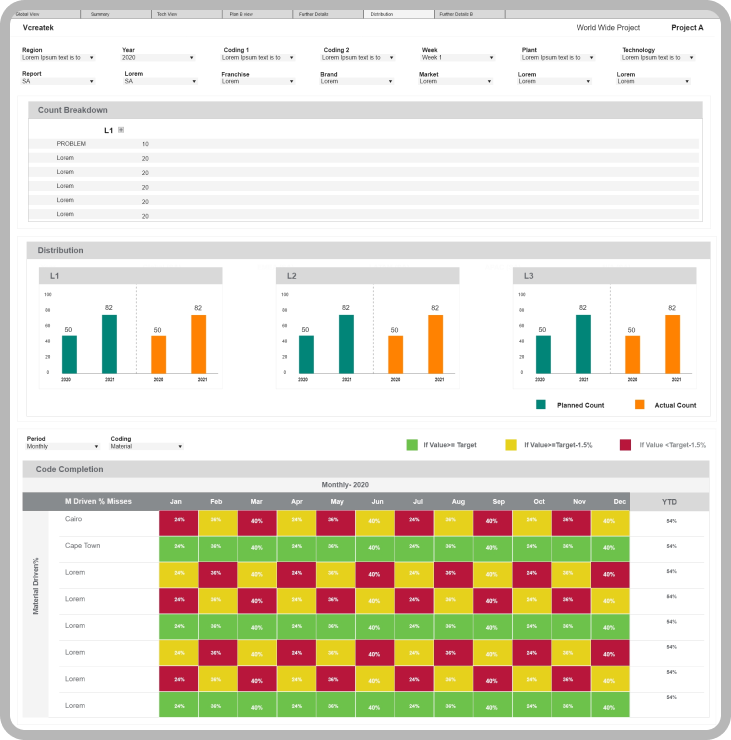
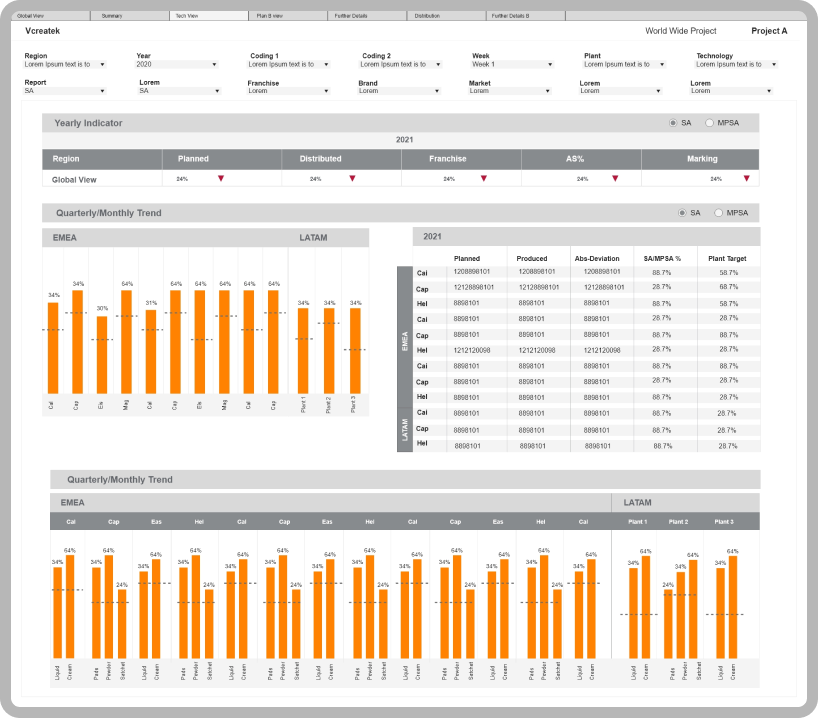
This report would enable all local/regional/global teams to deep dive into the MAPE/BIAS reporting with a new lens without leaving behind the regional capabilities which are currently embedded as part of regional reporting.
This dashboard allows the measure of two metrics SA and MPSA with great detail. Mesauring their performance across, region and comparing them with different scenarios.
DEsc
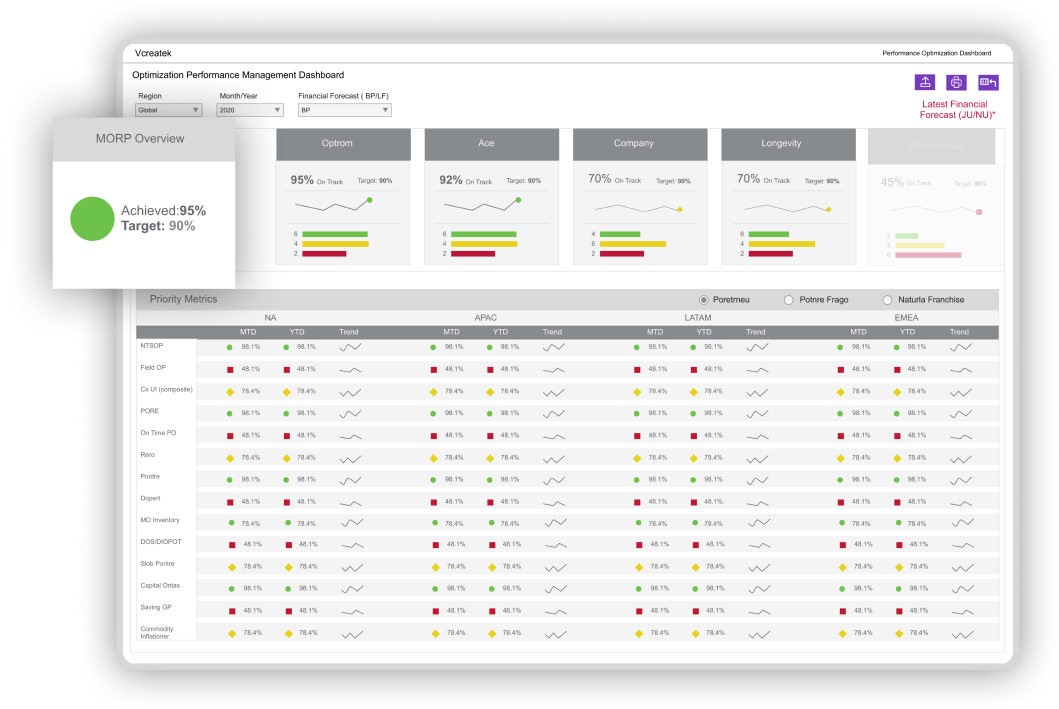
OPM is a Performance Management Tool which aim to enhance & provide a profound insight into the performance of multiple KPI’s & categories for the Senior Leadership
We have diverse offerings integrated with the latest technical insights that would burgeon exciting opportunities for you and your business!
Corporate Office
VCREATEK CONSULTING SERVICES PVT LTD
A3, 3rd Floor,
Vascon Weikfield Chambers,
Opp. Hyatt Regency, Viman Nagar,
Pune, Maharashtra.
411014
Delivery Center
VCREATEK CONSULTING INC
1 Lincoln Highway,
Suite 17, Edison,
NJ. 08820
Sales Office
VCREATEK CONSULTING
Schrieksebaan 280,
3140 Keerbergen
Sales Office
VCREATEK CONSULTING
234, Century Warf,
Chantlery,
Cardiff CF10 5NQ